R base graphics, statistical functions
Mikhail Dozmorov
Virginia Commonwealth University
09-29-2020
Basic plotting
R graphic regions

R graphic regions
par(mar=c(5.1, 4.1, 4.1, 2.1), mgp=c(3, 1, 0), las=0)
parsets or adjusts plotting parameters. Here we consider the following three parameters: margin size (mar), axis label locations (mgp), and axis label orientation (las)
mar– A numeric vector of length 4, which sets the margin sizes in the following order: bottom, left, top, and right. The default isc(5.1, 4.1, 4.1, 2.1)mgp– A numeric vector of length 3, which sets the axis label locations relative to the edge of the inner plot window. The first value represents the location of the labels (i.e., xlab and ylab in plot), the second the tick-mark labels, and third the tick marks. The default isc(3, 1, 0)las– A numeric value indicating the orientation of the tick mark labels and any other text added to a plot after its initialization. The options are as follows: always parallel to the axis (the default, 0), always horizontal (1), always perpendicular to the axis (2), and always vertical (3)
http://rfunction.com/archives/1302
Save and restore graphic parameters
old.par <- par("mar")par(mar = c(1, 1, 1, 1))plot(iris$Sepal.Length)
par(old.par)## NULLMultiple plots in one region
par(mfrow = c(1, 2))plot(iris$Sepal.Length)plot(iris$Sepal.Width)
par(mfrow = c(1, 1))Some functions used in plot region
text() points() lines()arrows()box()abline()Some common plot settings
col: color of lines, text, ...lwd: line widthlty: line typefont: font face (plain, bold, italic)pch: type of plotting symbolsrt: string rotationPlot examples
data(cars)# ?carsplot(cars$dist) # if a single vector object is given to plot(), the values are plotted on the y-axis against the row numbers or index
# plot(cars) # bivariate scatterplot# plot(cars$speed, type="o", col="blue") # graph cars using blue points overlayed by a line # plot(cars$dist,cars$speed, xlab="x axis", ylab="y axis", main="my plot", ylim=c(0,20), xlim=c(0,20), pch=15, col="blue") # Set a bunch of parametersx <- seq(0,20,by=2)y <- seq(0,10,by=1)plot(x,y,col="blue") # lines and points add graphics to the existing plotlines(x,y,col="green",lty="dashed")x2 <- c(0.5, 3, 5, 8, 12) y2 <- c(0.8, 1, 2, 4, 6) points(x2, y2, pch=16, col="green")
# curve(expr, from, to, add = FALSE, ...)# expr: an expression written as a function of 'x?# from, to: the range over which the function will be plotted.# add: logical; if 'TRUE' add to already existing plot.curve(sin(x), from = 0, to = 2*pi)
# curve(x^3 - 3*x, -2, 2)# curve(x^2 - 2, add = TRUE, col = "violet")# barplot(as.matrix(mtcars), main="Autos", ylab= "Total", beside=TRUE, col=rainbow(5))# barplot(mtcars$cyl)barplot(mtcars$cyl,col=rainbow(3))
data(faithful)attach(faithful)hist(eruptions, main = "Old Faithful data", prob = T)
# hist(eruptions, main = "Old Faithful data", prob = T, breaks=18)# boxplot(faithful) # same as boxplot(eruptions, waiting)Add legends to plots
with(iris, plot(Sepal.Length, Sepal.Width, pch=as.numeric(Species), cex=1.2,ylim=c(1,6)))legend("topright", c("setosa", "versicolor", "virginica"), cex=1.5, pch=1:3)
Saving plots
- Save to PDF
pdf("filename.pdf", width = 7, height = 5)plot(1:10, 1:10)dev.off()Other formats:
bmp(),jpg(),pdf(),png(), ortiff()Click Export in the Plots window in RStudio
Learn more
?Devices
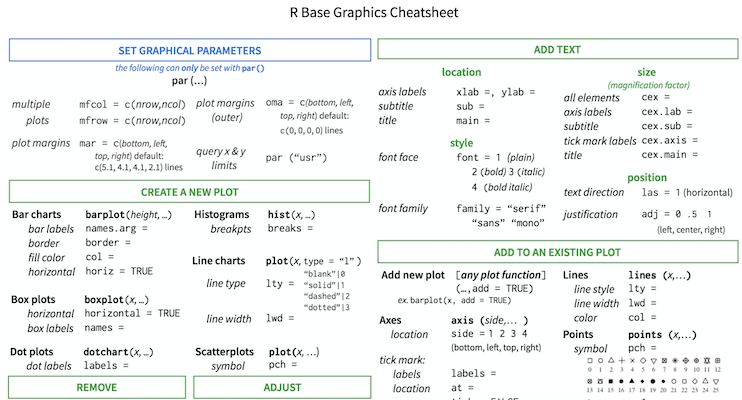
R base graphic cheat-sheet

https://github.com/nbrgraphs/mro/blob/master/BaseGraphicsCheatsheet.pdf
Useful functions in stats
data(trees) # load data to global environmentattach(trees)qqnorm(Height) # A normal QQ plot
Useful functions in stats
# ?ecdf() # Empirical CDF(x)Fn <- ecdf(x <- rnorm(12))# plot(Fn)curve(Fn)
Useful functions in stats
Prefix each R distribution name with + ‘d’ for the density or mass function, + ‘p’ for the CDF, + ‘q’ for the percentile function (also called the quantile), + ‘r’ for the generation of pseudorandom variables
dchisq()pchisq()qchisq()rchisq()Examples of density functions
| Function | Distribution |
|---|---|
| dnorm | Normal |
| dpois | Poisson |
| dbinom | Binomial |
| dchisq | Chi-squared |
| dt | Student’s t |
| dunif | Uniform |
x=rnorm(100)y=rnorm(100)plot(x, y)
qnorm(.75,mean=10,sd=2) # 3rd quartile of N(mu = 10,sigma = 2)## [1] 11.34898qnorm(c(0.05, 0.10, 0.20, 0.95),mean=10,sd=2)## [1] 6.710293 7.436897 8.316758 13.289707qt(.95,df=20) # 95th percentile of t(20)## [1] 1.724718x<-rchisq(100,1)plot(x)
hist(x)
x<-dbinom(3:10,size=10,prob=.25) # P(X=3) for X ~ Bin(n=10, p=.25)barplot(x)
plot(x)
plot(0:10, dbinom(0:10, size=10, prob=.25), type = "h", lwd = 30)
plot(3:10, x, type = "h", lwd = 30, main = "Binomial Probabilities w/ n = 10, p = .25", ylab = "p(x)") # which is gives the histogram-like vertical lines
# lwd option (the default width is 1) controls line thicknessdpois(0:2, lambda=4) # P(X=0), P(X=1), P(X=2) for X ~ Poisson## [1] 0.01831564 0.07326256 0.14652511x<- dpois(0:20, lambda=4)barplot(x)
# plot(x)pbinom(3,size=10,prob=.25) # P(X <=3) in the above distribution## [1] 0.7758751x<- pbinom(3:10,size=10,prob=.25)plot(x)
More useful stats functions
lm(Sepal.Length~Sepal.Width, data=iris) # simple linear regression## ## Call:## lm(formula = Sepal.Length ~ Sepal.Width, data = iris)## ## Coefficients:## (Intercept) Sepal.Width ## 6.5262 -0.2234glm(ifelse(Species=="setosa",1,0)~Sepal.Width, family="binomial",data=iris) # logistic regression## ## Call: glm(formula = ifelse(Species == "setosa", 1, 0) ~ Sepal.Width, ## family = "binomial", data = iris)## ## Coefficients:## (Intercept) Sepal.Width ## -15.72 4.79 ## ## Degrees of Freedom: 149 Total (i.e. Null); 148 Residual## Null Deviance: 191 ## Residual Deviance: 123.8 AIC: 127.8More useful stats functions
t.test(iris$Sepal.Length,iris$Petal.Length)## ## Welch Two Sample t-test## ## data: iris$Sepal.Length and iris$Petal.Length## t = 13.098, df = 211.54, p-value < 2.2e-16## alternative hypothesis: true difference in means is not equal to 0## 95 percent confidence interval:## 1.771500 2.399166## sample estimates:## mean of x mean of y ## 5.843333 3.758000aov(Sepal.Length~Species,data=iris)## Call:## aov(formula = Sepal.Length ~ Species, data = iris)## ## Terms:## Species Residuals## Sum of Squares 63.21213 38.95620## Deg. of Freedom 2 147## ## Residual standard error: 0.5147894## Estimated effects may be unbalancedMore useful stats functions
chisq.test(iris$Petal.Length,iris$Species)## Warning in chisq.test(iris$Petal.Length, iris$Species): Chi-squared## approximation may be incorrect## ## Pearson's Chi-squared test## ## data: iris$Petal.Length and iris$Species## X-squared = 271.8, df = 84, p-value < 2.2e-16fisher.test(mtcars$gear, mtcars$carb)## ## Fisher's Exact Test for Count Data## ## data: mtcars$gear and mtcars$carb## p-value = 0.2434## alternative hypothesis: two.sidedRegression models
Regression models can be used to estimate how the expected value of a dependent variable changes as independent variables change.
In R, regression formulas take this structure:
## Generic code[response variable] ~ [indep. var. 1] + [indep. var. 2] + ...Notice that a tilde, ~, is used to separate the independent and dependent variables and that a plus sign, +, is used to join independent variables. This format mimics the statistical notation:
Yi∼X1+X2+X3
Conventions for linear models
| Convention | Meaning |
|---|---|
| I() | evaluate the formula inside I() before fitting (e.g., I(x1 + x2)) |
| : | fit the interaction between x1 and x2 variables |
| * | fit the main effects and interaction for both variables (e.g., x1*x2 equals x1 + x2 + x1:x2) |
| . | include as independent variables all variables other than the response (e.g., y ~ .) |
| 1 | intercept (e.g., y ~ 1 for an intercept-only model) |
| - | do not include a variable in the data frame as an independent variables (e.g., y ~ . - x1); usually used in conjunction with . or 1 |
Linear models
To fit a linear model, you can use the function lm(). This function is part of the stats package, which comes installed with base R
mod <- lm(mpg ~ hp, data = mtcars)# Check class() and str() of the mod objectThis previous call fits the model:
Yi=β0+β1X1,i+ϵi
Manipulating the lm object
| Function | Description |
|---|---|
| summary | Get a variety of information on the model, including coefficients and p-values for the coefficients |
| coefficients | Pull out just the coefficients for a model |
| fitted | Get the fitted values from the model (for the data used to fit the model) |
| plot | Create plots to help assess model assumptions |
| residuals | Get the model residuals |
class(mod)## [1] "lm"plot(mod)


Manipulating the lm object
mod_coef <- coefficients(mod)library(ggplot2)ggplot(mtcars, aes(x = hp, y = mpg)) + geom_point(size = 1) + xlab("Miles/(US) gallon") + ylab("Gross horsepower") + geom_abline(aes(intercept = mod_coef[1], slope = mod_coef[2]), col = "red")
Working with text
- The
grep()function takes as parameters the pattern and a character vector as the data to search through for the pattern. Parameters:ignore.case = FALSE- by default it is case sensitivevalue = FALSE- by default returns vector with index values of match; otherwise returns the valuesfixed = FALSE- by default treats pattern as regular expression; otherwise will match exactinvert = FALSE- by default matches the pattern; otherwise returns what is not matched
strings <- c('abcd', 'dabc', 'abcabc')pattern <- '^abc'print (grep(pattern, strings))## [1] 1 3grepl() - grep logical, returns a vector of the same length as a string, with TRUE/FALSE pattern matching
Regular expressions
Some useful regular expression operators include:
| Expression | Description |
|---|---|
| [] | Matches a set. [abc] matches a, b, or c. [a-zA-Z] matches any letter. [0-9] matches any number. “^” negates a set, [^abc] matches d, e, f, etc. |
| ^ | Starting position anchor. ^abc finds lines starting with abc |
| \$ | Ending position anchor. xyz\$ finds lines ending with xyz |
| \ | Escape symbol, to find special characters. \* will find *. \n matches new line character, \t – tab character |
| * | Match the preceding element zero or more times. a*b matches ab, aab, aaab, etc. |
Extended regular expressions
| Expression | Description |
|---|---|
| ? | Matches the preceding element zero or one time. a*b matches b, ab, but not aab |
| + | Matches the preceding element one or more times. a+b matches ab, aab, etc. |
| | | OR operator. "abc|def" matches abc or def |
| . | Any character |
Special characters
| Expression | Description |
|---|---|
| \n | Newline |
| \r | Return |
| \t | Tab |
R is more than a programming language
Numerous packages are available to extend R functionality
Publication-quality figures, documents in Word, PDF, and HTML formats (Rmarkdown). Templates for journal articles
Presentations, from basic (
ioslides,beamer) to advanced (xaringan)Web sites for blogs (
blogdown), books (bookdown), packages (pkgdown)- Templates for CV, resume, thesis are available
Dynamic web applications using Shiny
Interface with other languages, like C (
Rcpp), Python (reticulate)Many more cool usages...
R base graphics
plot()generic x-y plottingbarplot()bar plotsboxplot()box-and-whisker plothist()histograms

http://manuals.bioinformatics.ucr.edu/home/R_BioCondManual#TOC-Graphical-Procedures
Other useful plots
qqnorm(),qqline(),qqplot()- distribution comparison plotspairs()- pair-wise plot of multivariate data
http://manuals.bioinformatics.ucr.edu/home/R_BioCondManual#TOC-Some-Great-R-Functions
Don't use barplots

Weissgerber T et.al., "Beyond Bar and Line Graphs: Time for a New Data Presentation Paradigm", PLOS Biology,2015
https://cogtales.wordpress.com/2016/06/06/congratulations-barbarplots/
R base graphics
stats::heatmap()- basic heatmap
Alternatives:
gplots::heatmap.2()- an extension of heatmapheatmap3::heatmap3()- another extension of heatmapComplexHeatmap::Heatmap()- highly customizable, interactive heatmap
Other options:
pheatmap::pheatmap()- grid-based heatmapNMF::aheatmap()- another grid-based heatmap
Interactive heatmaps
d3heatmap::d3heatmap()- interactive heatmap in d3heatmaply::heatmaply()- interactive heatmap with better dendrogramsplotly- make ggplot2 plots interactive
Heatmaps in R 20 min video by Tal Galili
Interactive plots in R blog post by Dave Tang
Special plots
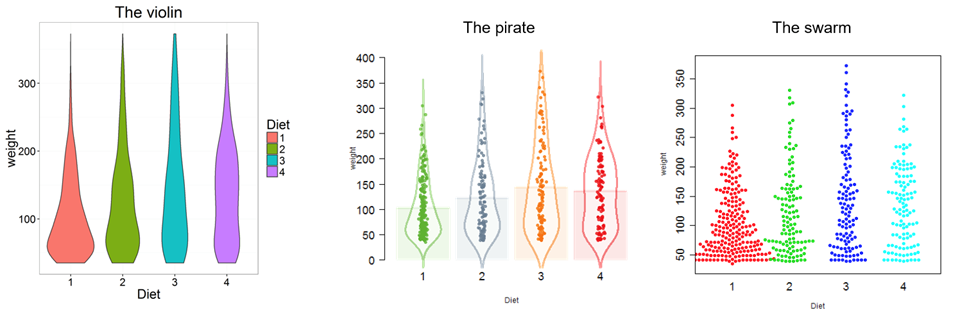
vioplot(): Violin plotPiratePlot(): violin plot enhancedbeeswarm(): The Bee Swarm Plot, an Alternative to Stripchart
